Tutorial #3 - Entering Data
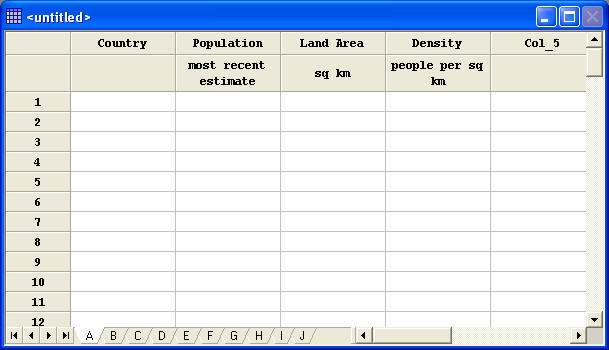
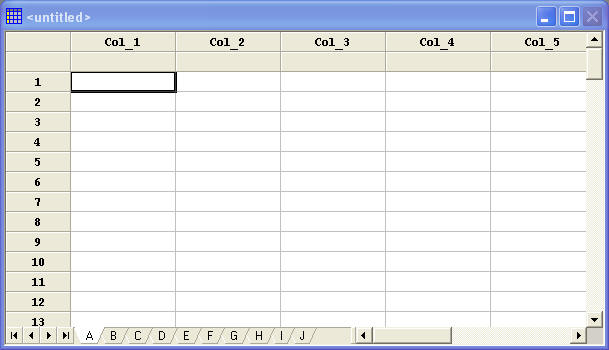
In order to analyze data in STATGRAPHICS Centurion, it must be placed into the STATGRAPHICS DataBook. The DataBook consists of 10 datasheets, indicated by the letters A through J, each containing a rectangular array of rows and columns:
In a typical datasheet, each row contains information about an individual sample, case or observation, while each column represents a variable.
As an example, suppose we wished to enter the
following data describing 20 countries (source: Wikipedia.com):
| Country | Population | Land area |
| sq km | ||
| Argentina | 40,301,927 | 2,766,890 |
| Australia | 21,250,000 | 7,741,220 |
| Canada | 33,217,000 | 9,984,670 |
| Czech Republic | 10,381,130 | 78,866 |
| Colombia | 44,065,000 | 1,141,748 |
| France | 64,473,140 | 647,843 |
| Germany | 82,210,000 | 357,021 |
| India | 1,120,000,000 | 3,287,590 |
| Italy | 59,337,888 | 301,318 |
| Japan | 127,433,494 | 377,873 |
| Malaysia | 27,496,000 | 329,847 |
| Mexico | 108,700,891 | 1,972,550 |
| Netherlands | 16,408,557 | 41,526 |
| New Zealand | 4,252,000 | 268,680 |
| Spain | 45,200,737 | 504,030 |
| South Africa | 48,600,000 | 1,221,037 |
| South Korea | 50,000,000 | 99,646 |
| Switzerland | 7,591,400 | 41,285 |
| United Kingdom | 60,587,300 | 244,820 |
| United States | 303,598,000 | 9,826,630 |
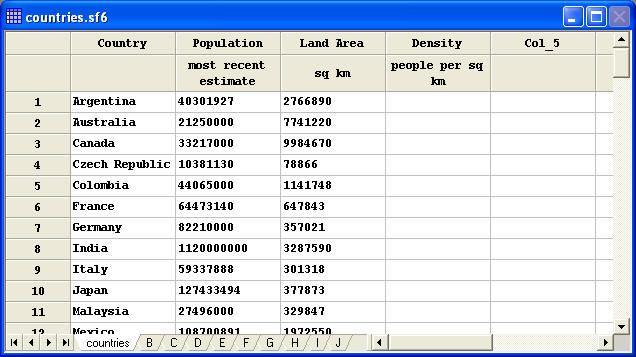
When entering this data into a STATGRAPHICS Centurion datasheet, the information about each country would be placed into a different row. Three columns would be created to hold the names of the country and the numeric data. The header rows are used to hold names by which each column is referenced and an optional comment.
To enter the data and save it in a STATGRAPHICS data file:
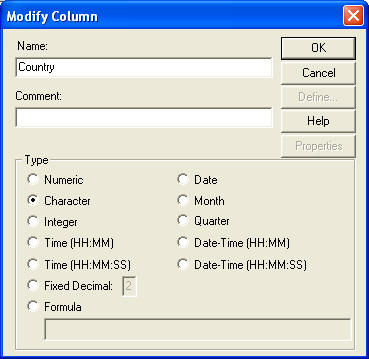
Double-click on the column header for the first column in datasheet A, where it currently says "Col_1". This will display the "Modify Column" dialog box which can be used to enter information about the first column:
Enter "Country" in the Name field and select the radio button for Character. Each column in a STATGRAPHICS datasheet must have a unique name. Valid names may contain between 1 and 32 characters, including letters, digits, and any special symbol (including blanks) that is not reserved for algebraic operations. The reserved symbols that may not be used in column names are:
‘ “ . > < ~ ! & , ; + - * / ^ = | ( )
In addition, column names may not begin with a number.
Each column also has a type, which applies to the entire column. To enter non-numeric data, set the type to Character. Then press OK.
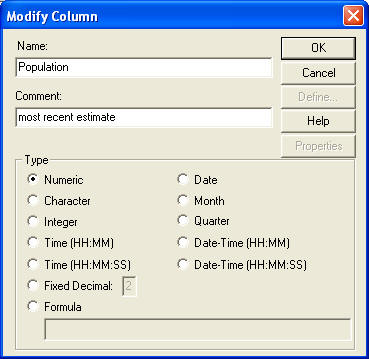
Double-click on the second column, enter the following information, and press OK:
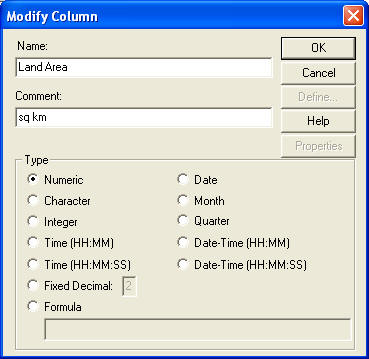
Double-click on the third column, enter the following information, and press OK:
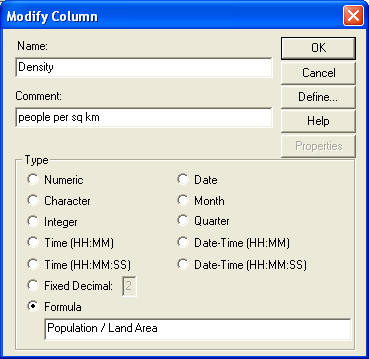
To create an additional column with the population density for each country, double-click on the header of the fourth column and enter:
The fourth column is defined above to be a Formula column, calculated by dividing Population by Land Area. It will be automatically calculated from the other columns. Press OK, after which the datasheet should appear as shown below:
Now type the data for each country in the cells of the datasheet, using the arrow keys to move from cell to cell. (NOTE: do not type the commas in the numeric values). After you are done, the datasheet should look like that shown below:
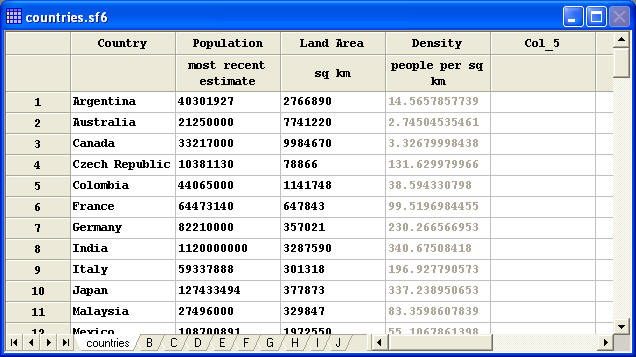
Notice that the Density column is not updated when you enter each row. It will be updated as soon as the data values are needed. Or you can select Edit - Update Formulas from the top menu to update them now:
Formula columns appear in light grey to indicate that they are calculated from other columns.
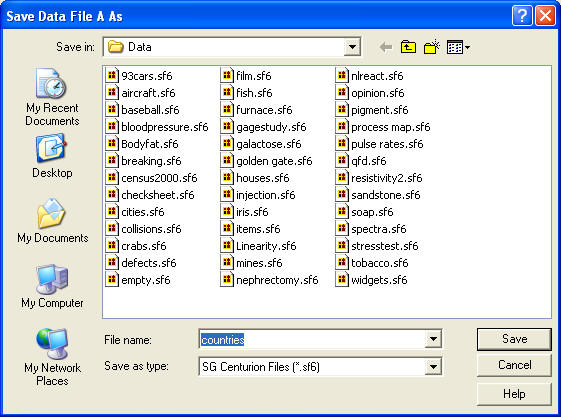
To save the data, go to the main menu and select File - Save - Save Data File and enter countries for the name of the file in which you wish to save the data:
By default, the data will be saved in a STATGRAPHICS data file with the extension .sf6. This is a special file type that STATGRAPHICS can read very quickly. However, it is not accessible by other programs. To save the data in a different file type, such as a CSV file that could be read by Microsoft Excel, change the Save as type selection.
The data have now been saved and are ready to be analyzed.