Tutorial #5 - Using the StatWizard
The StatWizard is designed to serve several
functions:
- It helps users select statistical procedures that are
appropriate for their data.
- It provides a search facility to help locate specific
statistics and tests.
- It contains a mechanism to apply one or more analyses
to each level of a specified “BY” variable.
Each function is illustrated below.
Selecting Statistical Procedures Based on the Type of Data
- If the STATGRAPHICS DataBook currently contains data, select File -
Close - Close StatFolio from the main STATGRAPHICS menu to clear all
data and analyses.
- Select File - Open - Open Data Source from the main STATGRAPHICS
menu.
- On the Open Data Source dialog box, select STATGRAPHICS data
file:
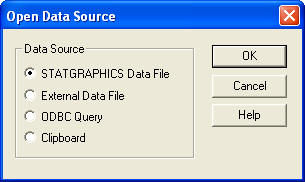
and then open the sample data file 93cars.sf6.
- On the main toolbar under the STATGRAPHICS menu, press the button
resembling a wizard's cap
 to invoke the
StatWizard:
to invoke the
StatWizard:
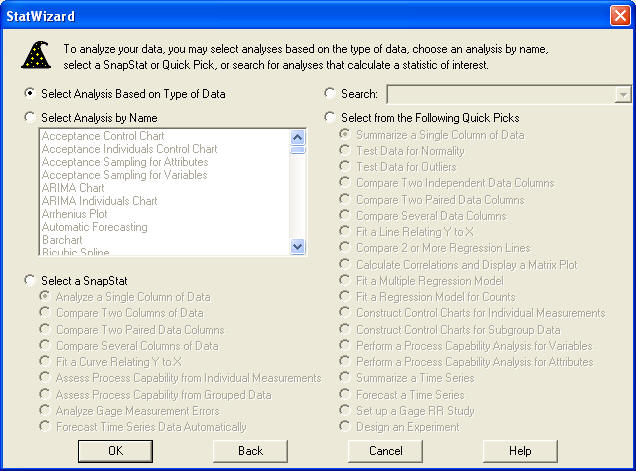
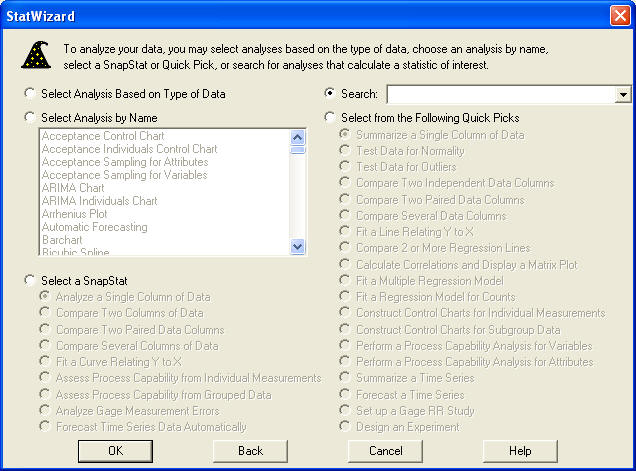
- Be sure that the Select Analysis Based on Type of Data button is
selected and then press OK.
- On the next dialog box, use the list of column names and the arrow
buttons to put 2 column names into the appropriate fields as shown below:
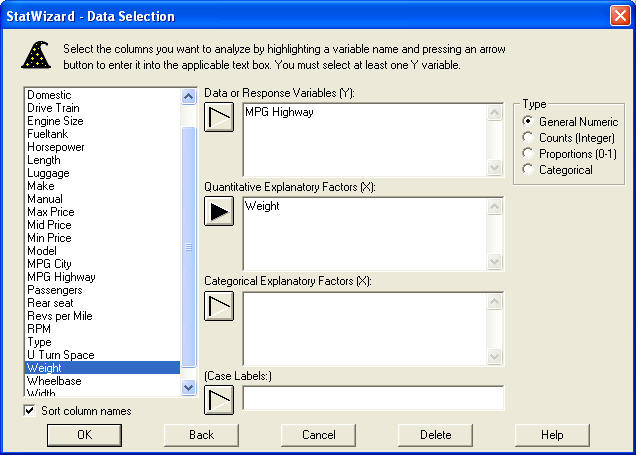
Be sure that the radio button for Type is set to General
Numeric, indicating that the Y variable MPG Highway contains
numeric values measured over a continuous scale. Then press OK.
- On the Row Selection dialog box, be sure that the All Rows
radio button is selected:
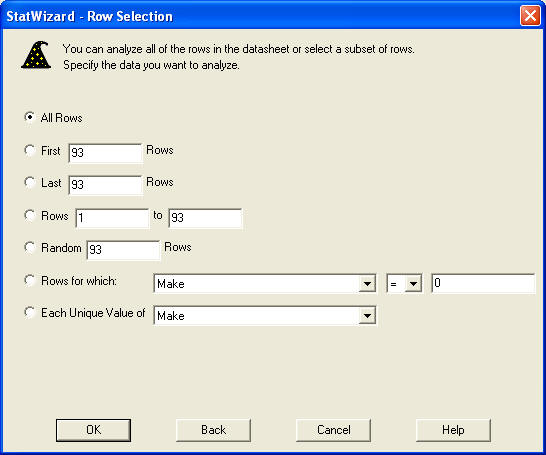
This indicates that all rows in the DataBook should be analyzed. Press
OK.
- When asked if you wish to transform any of the variables, press Yes:

- The first transformation dialog box offers to transform MPG Highway:
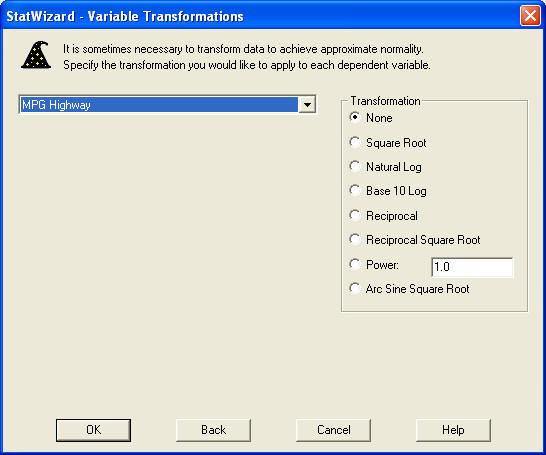
On this dialog box, leave the Transformation checkmark on None
and press OK.
- The second transformation dialog box offers to transform Weight:
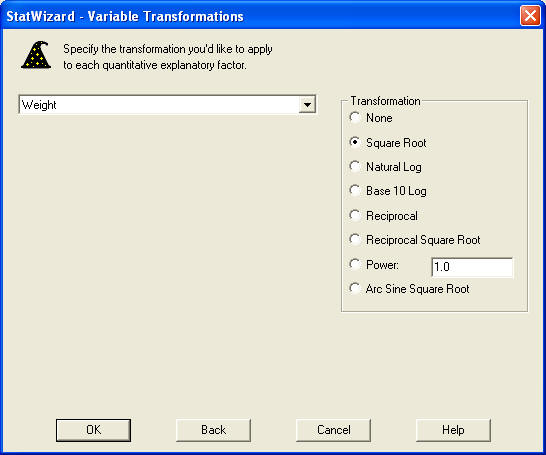
Set the Transformation radio button to Square Root.
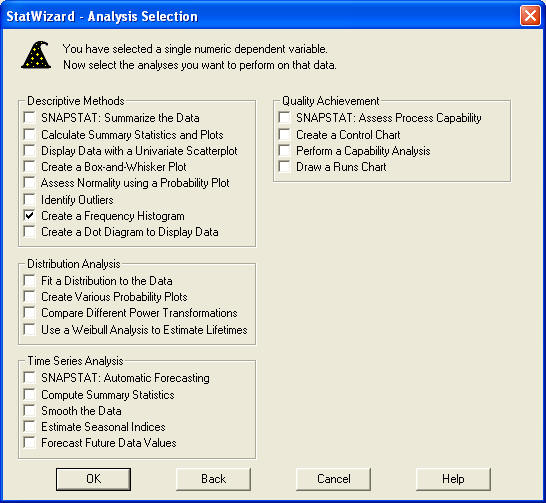
- The final StatWizard dialog box displays checkboxes for all statistical
procedures that are designed to analyze the type of data you have specified:
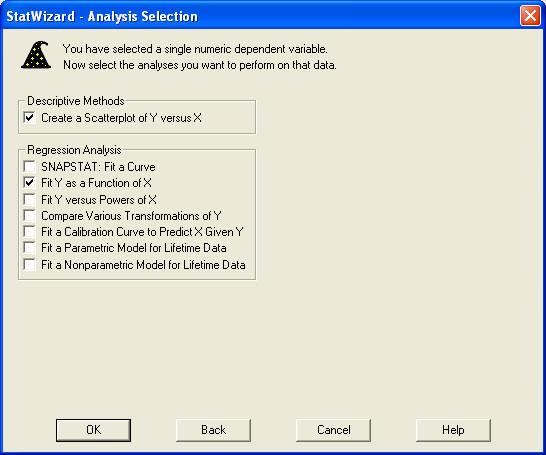
Check the boxes next to Create a Scatterplot of Y versus X and
Fit Y as a Function of X. Then press OK.
- STATGRAPHICS will now indicate the number of analysis windows that it is
about to create and ask you to confirm that it should proceed:
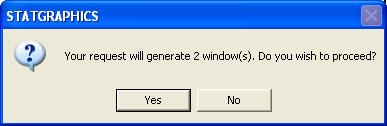
Press Yes.
- Two new windows will now be created containing the procedures you have
selected. One of the windows is a Simple Regression analysis, where a
line has been fit relating MPG Highway to SQRT(Weight):
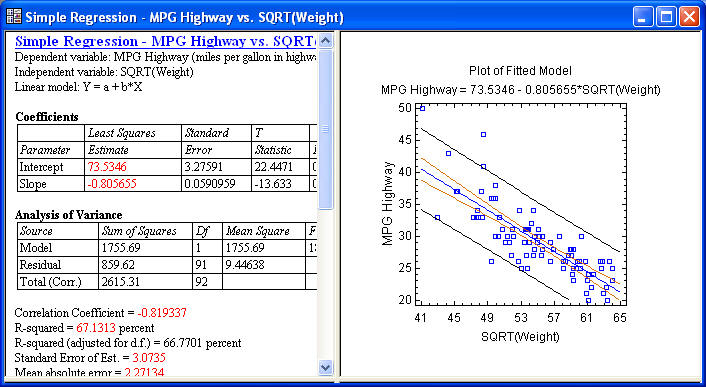
You may now use each of the analyses as if they had been selected from
the main STATGRAPHICS menu.
Searching for Specific Statistics and Tests
- To determine which STATGRAPHICS procedures calculate a particular
statistical procedure or test, such as a probability plot, press the button
resembling a wizard's cap to invoke the
StatWizard and select the Search radio button:
- Use the dropdown list to select Probability plot:
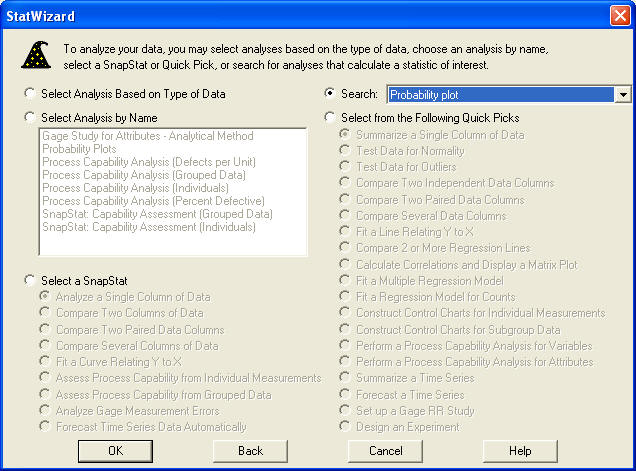
- Select the Select Analysis by Name radio button to see a list of
all statistical procedures that create probability plots:
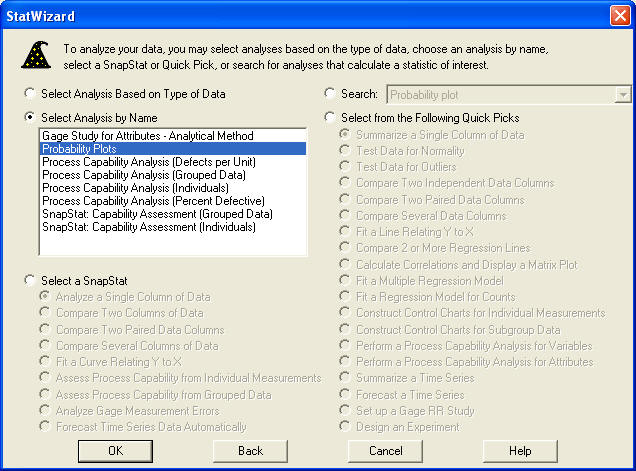
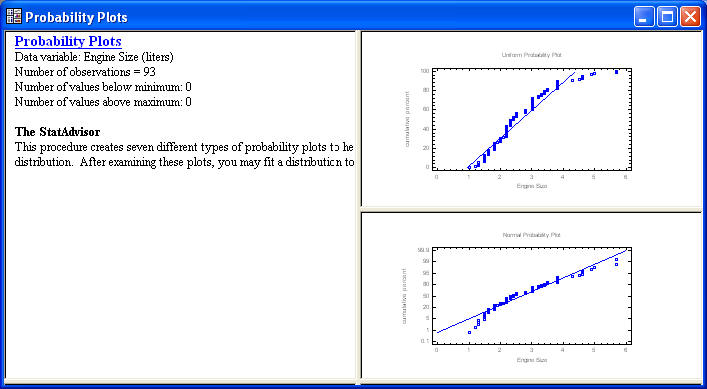
- Highlight Probability Plots and press OK to display the data
input dialog box for that procedure:
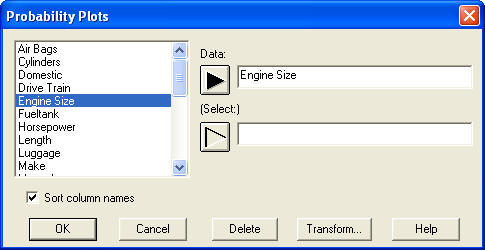
- Enter Engine Size into the data field and press OK to
proceed as if you had selected that procedure from the main menu:
Repeating Analyses for Each Level of a BY Variable
- On occasions, you may want to repeat one or more analyses for every
unique value found in a selected column. For example, press the button
resembling a wizard's cap to invoke the
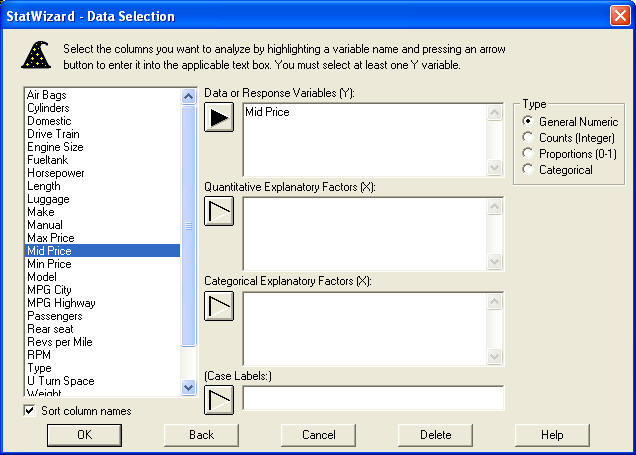
StatWizard and choose Select Analysis Based on Type of Data:

- On the Data Selection dialog box, select Mid Price as the
Y variable and press OK:
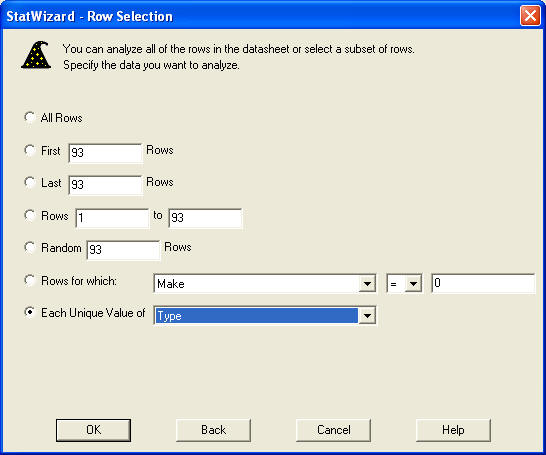
- On the Row Selection dialog box, set the radio button to Each
Unique value of and use the dropdown list to select Type:
- When asked whether you wish to transform any of the variables, press
No:
- On the next dialog box, select Create a Frequency Histogram:
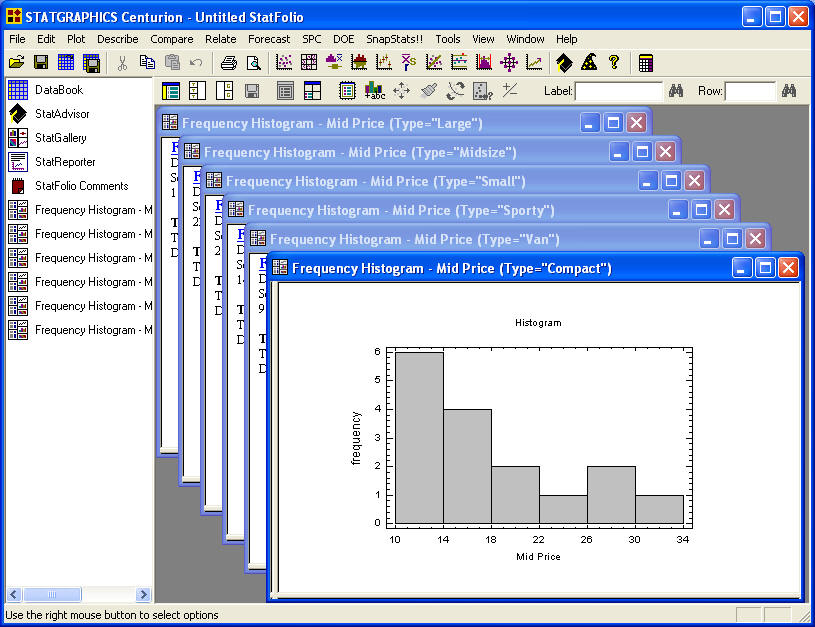
- When the program asks whether you wish to proceed with the creation of 6
windows, press Yes:

- STATGRAPHICS will now create a frequency histogram of Mid Price
for each unique value of Type. To arrange the panes as shown below,
select Window - Cascade from the main STATGRAPHICS menu:
Return