|
Version 16 of STATGRAPHICS Centurion offers many additions
and enhancements. Some of the most exciting are
summarized below:
-
New statistical procedures
-
Enhancements to existing
statistical procedures
-
Data handling
-
User interface
-
Graphics
NEW STATISTICAL PROCEDURES
| Design of Experiments Wizard
The Experimental Design section of
STATGRAPHICS contains a new wizard that assists
users in constructing and analyzing designed
experiments. It guides the user through twelve
important steps in the creation of the design:
Step 1: Define responses
Step 2: Define exp. factors
Step 3: Select design
Step 4: Select model
Step 5: Select runs
Step 6: Evaluate design
Step 7: Save experiment
Step 8: Analyze data
Step 9: Optimize responses
Step 10: Save results
Step 11: Augment design
Step 12: Extrapolate
It also includes:
1. New diagnostic plots
such as Prediction Variance Plots, Prediction
Profiles, Variance Dispersion Plots, and
Fraction of Design Space plots.
2. The ability to include
both process and mixture variables in a single
design.
3. Integrated facilities
for multiple response optimization based on
desirability functions.
4. An option for
interactively exploring multiple dimensions
using either response surface or contour plots.
5. Easier extrapolation of
fitted models, including path of steepest ascent
identification.
6. New facilities for
creating robust parameter design using either
crossed factors or Montgomery's combined
approach. |
3-D Contour Plot

3-D Mesh Plot

Variance Dispersion Graph

Fraction of Design Space Plot
 |
| Sequential Sampling
Sequential probability ratio tests can be
constructed for testing the mean or standard
deviation of a normal distribution, the
probability parameter of a binomial
distribution, or the rate parameter of a Poisson
distribution. Unlike tests with a predetermined
sample size, sequential tests obtain samples one
at a time. After each sample is obtained, one of
three decisions is made: accept the null
hypothesis, reject the null hypothesis, or
continue sampling. In many cases, a decision
will be reached more quickly than from a fixed
size hypothesis test. In addition to the test,
operating characteristic (OC) and average sample
number (ASN) curves are provided. |
 |
| Correspondence Analysis
This procedure creates a map of the rows and
columns in a two-way contingency table for the
purpose of providing insights into the
relationships amongst the categories of the row
and/or column variables. Often, no more than two
or three dimensions are needed to display most
of the variability or “inertia” in the table. An
important part of the output is a correspondence
map on which the distance between two categories
is a measure of their similarity. |
 |
| Multiple Correspondence
Analysis This procedure
creates a map of the associations among
categories of two or more variables. It
generates a map similar to that of the
Correspondence Analysis procedure. However,
unlike that procedure which compares categories
of each variable separately, this procedure is
concerned with interrelationships amongst the
variables. |
 |
| Reliability of Repairable
Systems Two procedures
have been added to analyze data
consisting of failure times from systems that
can be repaired, one for continuous times and
one for interval data. It is assumed that when
the system fails, it is immediately repaired and
placed in service again. The goal of the
analysis is to develop a model that can be used
to estimate failure rates or quantities such as
the MTBF (mean time between failures). |
 |
| One-Dimensional Point Process
Models Constructs models for events
occurring in one dimension (usually time or
space). Includes homogeneous and non-homogeneous
Poisson process and renewal models with various
interevent time distributions. |
 |
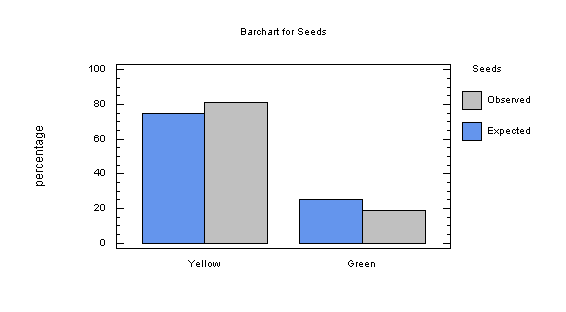
| Frequency Tables
This procedure analyzes a single column
containing previously tabulated counts. It
displays the counts using either a barchart or
piechart. Statistical tests may also be
performed to determine whether the data conform
to a set of multinomial probabilities. |
 |
| Sampling Distributions
The Sampling Distributions procedure
calculates tail areas and critical values for
four common sampling distributions. It also
plots the calculated results. |
 |
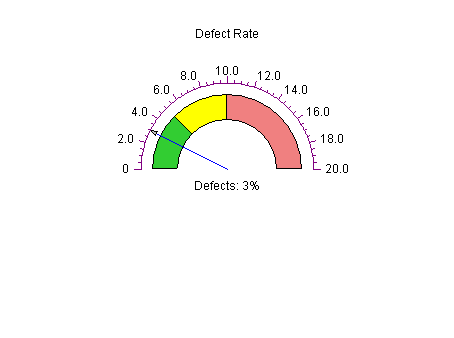
| Dashboard Gage Create
gages to display the status of critical quality
statistics. |
 |
MODIFICATIONS TO EXISTING PROCEDURES
| Simple Regression |
The Simple Regression procedure now permits
fitting models without a constant term.
|
| Multiple Variable Analysis |
The Multiple Variable Analysis procedure now
permits drawing box-and-whisker plots in the
diagonal positions of the Matrix Plot.
|
| Multiple Sample Comparison and Oneway
ANOVA |
The Variance Check
pane now conducts F-tests for all pairs of
samples, in addition to performing the overall
test for equality of variances. |
| Multiple Regression |
The Analysis Options dialog box has been
modified to make the Box-Cox and Cochrane-Orcutt
procedures more accessible. |
| Polynomial Regression |
The Analysis Options
dialog box has been modified to allow an offset
value to be specified. |
|
Distribution Fitting (Censored and Uncensored) |
Calculated tail areas and
critical values may now be saved. |
| Probability Distributions |
If only one distribution is
plotted, users may elect to shade an area of the
pdf. |
| Six Sigma Calculator |
The Six Sigma Calculator
has been converted from a single dialog box to a
full procedure. |
| Time Series Procedures |
The data input dialog boxes
have been modified to accept a second column
containing the times associated with each data
value. |
| Automatic Forecasting |
- The model list has
been reworked so that Random Walk and
Random Walk with Drift are separate
models.
- The option of
estimating or specifying parameters has been
structured to be on a model-by-model basis,
as is the choice to optimize parameters.
- Additional Model
Selection Criteria have been added.
- An Adjustments
button has been added to allow adjustments
to be applied before the models are fit:
|
| Control Charts |
-
The data input dialog
boxes now have a field for specifying the
date or time associated with each
observation or subgroup.
-
Certain control charts
now give the option of plotting
specification limits in addition to control
limits.
-
Alerts can be
automatically generated whenever points fall
beyond the control limits, runs rules are
violated, or selected capability indices
fall below specified limits.
|
DATA HANDLING
| Data Viewer The
new STATGRAPHICS Data Viewer allows the
user to create a table showing all or part of
the currently loaded data. The data may be
sorted based on up to 3 columns. The Select
field may also be used to display only a subset
of the rows.
|
DataViewer (MPG City >= 25)
Selection variable: MPG City >= 25
Number of columns: 6
Number of rows: 24
Number of complete cases: 24
|
Column |
Column |
Nonmissing |
Unique |
|
|
|
Name |
Type |
Values |
Values |
Minimum |
Maximum |
|
Make |
Character |
24 |
17 |
|
|
|
Model |
Character |
24 |
24 |
|
|
|
Type |
Character |
24 |
3 |
|
|
|
Passengers |
Numeric |
24 |
2 |
4.0 |
5.0 |
|
Mid Price |
Numeric |
24 |
23 |
7.4 |
18.4 |
|
MPG City |
Numeric |
24 |
11 |
25.0 |
46.0 |
|
| Variable Names All restrictions on
special characters in variable names have been
removed. |
|
| DataBook The maximum number of
sheets in the DataBook has been increased from
10 to 26. |
|
| Data Files The primary STATGRAPHICS
data file format has been changed from a
proprietary binary format to human-readable XML.
This enables users to edit the files outside of
STATGRAPHICS using any text editor. |
<?xml
version="1.0"?>
<statgraphics_data>
<COLUMNS>
<C1
Name="Make"
Comment=""
Type="C"
Width="13"/>
<C2
Name="Model"
Comment=""
Type="C"
Width="14"/>
<C3
Name="Price"
Comment=""
Type="N"
Width="13"/>
</COLUMNS>
<ROW>
<C1>Acura</C1>
<C2>Integra</C2>
<C3>35000</C3>
</ROW>
</statgraphics_data> |
| Excel Import Workbook created in
Excel 2007 format can now be imported directly
into the STATGRAPHICS DataBook. |
|
USER INTERFACE
| StatFolio Alerts
StatFolios may be set to automatically generate
alerts whenever certain conditions occur.
Message boxes, audio alarms, and automatic
e-mail notification are available options. |
 |
| Executing Procedures
The sequence of steps for executing procedures
has been modified as follows:
- A data input dialog
box is displayed.
- If the analysis has an
Analysis Options dialog box, it is displayed
so that the user can select options before
the analysis is run.
- A combined Tables and
Graphs dialog box is displayed so that the
user can select the desired tables and
graphs.
- An analysis window
opens with the selected tables and graphs.
The Tables and Graphs dialog box
contains a button labeled Store. When
pressed, the current selection of tables and
graphs becomes the default selection for the
current analysis. |
 |
| Repeat Analysis "BY"
A new option has been added to the Edit menu
that allows users to run an analysis for each
unique value contained in a “BY” variable. |
 |
| File Menu MRU List
The MRU (most recently used file) list has been
extended to 6 files each for StatFolios, data
files, and XML scripts. |
|
| System Preferences Users may now
exchange system preferences by exporting them to
an XML file and importing them into another copy
of the program. |
 |
| XML Scripts
The File menu has two new additions: Execute
XML Script and Create XML Script. XML
scripts are an alternative to StatFolios that allow
users to read data and create analyses through a
scripting language. This same scripting language
is understood by the new STATGRAPHICS .NET Web
Services. |
<?xml
version="1.0"?>
<statgraphics>
<Data
Sheet="A"
Source="stresstest.sgd"/>
<Proc
Name="ANOVA">
<Input>
<Y
Value="minutes"/>
<Factor
Value="body
fat"/>
<Factor
Value="gender"/>
<Factor
Value="smoking"/>
</Input>
<Options>
<MaxInteraction
Value="2"/>
</Options>
<Output>
<Table
Name="Summary"/>
<Table
Name="ANOVATable"/>
<Graph
Name="Scatterplot">
<Factor
Value="2"/>
</Graph>
<Graph
Name="GraphANOVA">
<YaxisTickmarkSize
Value="9"/>
</Graph>
</Output>
</Proc>
</statgraphics> |
GRAPHICS
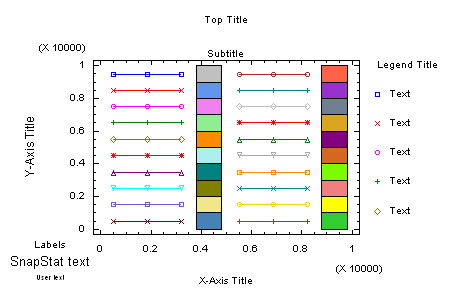
| Graphics Profile Designer
A new procedure has been added to assist user
in setting graphics profiles. It displays sample
2D and 3D plots that use all of the STATGRAPHICS
graphics attributes so that they may be easily
set and saved in user profiles.
|
 |
| Named Web Colors Colors may now be
selected based on common web names, in addition
to the interactive color selection dialog boxes. |
 |
|
Point Labels
Labels may now be attached
to points displayed on scatterplots. The labels
will be automatically repositioned if necessary in
order to remain close to the points.
|
 |
|
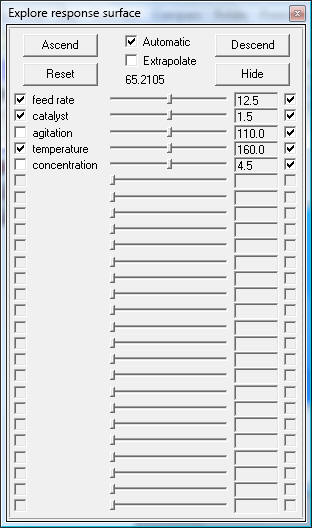
Interactive Exploration of Response Surface
and Contour Plots Response surface and
contour plots can be explored interactively
using the dialog box on the right. The sliders
change the levels of the variables in the
underlying statistical model, which is
immediately reflected in the plot. The Ascend
and Descend buttons instruct the program
to move in steps along the path of steepest
ascent, which causes the surface or contour plot
to change dynamically. |
 |
| Pan and Scroll
A new icon has been added to the toolbar in the
shape of a magnifying glass  that
allows users to zoom in on a graph and then
scroll and pan. This is particularly helpful
when displaying a large number of data points. that
allows users to zoom in on a graph and then
scroll and pan. This is particularly helpful
when displaying a large number of data points.
|
 |
| Interactive 3D Rotation
When a 3D graph is maximized, scrollbars are now
placed below and to the right of the graph. The
scrollbar at the bottom allows the user to
interactively rotate the graph left or right.
The scrollbar at the right rotates the graph up
or down. |
 |
|

