|
An important technique
for analyzing the effect of categorical factors on a
response is to perform an Analysis of Variance. An ANOVA
decomposes the variability in the response variable amongst
the different factors. Depending upon the type of analysis,
it may be important to determine: (a) which factors have a
significant effect on the response, and/or (b) how much of
the variability in the response variable is attributable to
each factor.
STATGRAPHICS Centurion
provides several procedures for performing an analysis of
variance:
1.
One-Way ANOVA - used when
there is only a single categorical factor. This is
equivalent to comparing multiple groups of data.
2.
Multifactor ANOVA - used
when there is more than one categorical factor, arranged
in a crossed pattern. When factors are crossed, the
levels of one factor appear at more than one level of
the other factors.
3.
Variance Components Analysis
- used when there are multiple factors, arranged in a
hierarchical manner. In such a design, each factor is
nested in the factor above it.
4.
General Linear Models - used whenever there are
both crossed and nested factors, when some factors are
fixed and some are random, and when both categorical and
quantitative factors are present.
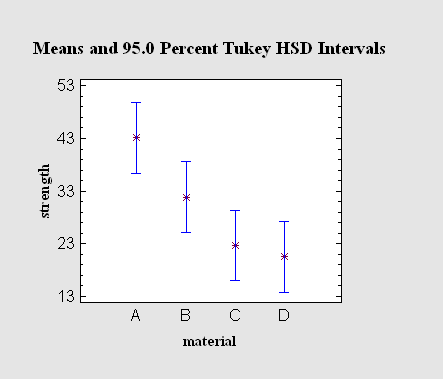
One-Way ANOVA
A one-way analysis of
variance is used when the data are divided into groups
according to only one factor. The questions of interest are
usually: (a) Is there a significant difference between the
groups?, and (b) If so, which groups are significantly
different from which others? Statistical tests are provided
to compare group means, group medians, and group standard
deviations. When comparing means, multiple range tests are
used, the most popular of which is Tukey's HSD procedure.
For equal size samples, significant group differences can be
determined by examining the means plot and identifying those
intervals that do not overlap.
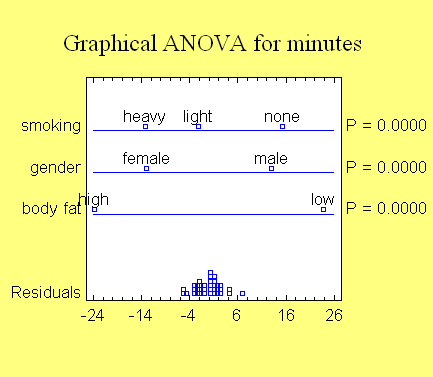
Multifactor ANOVA
When more than one factor
is present and the factors are crossed, a multifactor ANOVA
is appropriate. Both main effects and interactions between
the factors may be estimated. The output includes an ANOVA
table and a new graphical ANOVA from the latest edition of
Statistics for Experimenters by Box, Hunter and
Hunter (Wiley, 2005). In a graphical ANOVA, the points are
scaled so that any levels that differ by more than exhibited
in the distribution of the residuals are significantly
different.
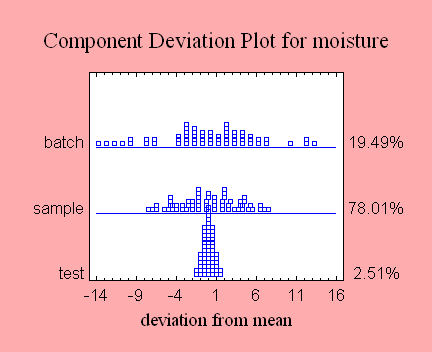
Variance Components Analysis
A Variance Components
Analysis is most commonly used to determine the level at
which variability is being introduced into a product. A
typical experiment might select several batches, several
samples from each batch, and then run replicates tests on
each sample. The goal is to determine the relative
percentages of the overall process variability that is being
introduced at each level.
General Linear Model
The General Linear
Models procedure is used whenever the above procedures
are not appropriate. It can be used for models with both
crossed and nested factors, models in which one or more of
the variables is random rather than fixed, and when
quantitative factors are to be combined with categorical
ones. Designs that can be analyzed with the GLM procedure
include partially nested designs, repeated measures
experiments, split plots, and many others. For example,
pages 536-540 of the book Design and Analysis of
Experiments (sixth edition) by Douglas Montgomery
(Wiley, 2005) contains an example of an experimental design
with both crossed and nested factors. For that data, the GLM
procedure produces several important tables, including
estimates of the variance components for the random factors.
Analysis of
Variance for Assembly Time
|
Source |
Sum of Squares |
Df |
Mean Square |
F-Ratio |
P-Value |
|
Model |
243.7 |
23 |
10.59 |
4.54 |
0.0002 |
|
Residual |
56.0 |
24 |
2.333 |
|
|
|
Total (Corr.) |
299.7 |
47 |
|
|
|
Type III Sums
of Squares
|
Source |
Sum of Squares |
Df |
Mean Square |
F-Ratio |
P-Value |
|
Layout |
4.083 |
1 |
4.083 |
0.34 |
0.5807 |
|
Operator(Layout) |
71.92 |
6 |
11.99 |
2.18 |
0.1174 |
|
Fixture |
82.79 |
2 |
41.4 |
7.55 |
0.0076 |
|
Layout*Fixture |
19.04 |
2 |
9.521 |
1.74 |
0.2178 |
|
Fixture*Operator(Layout) |
65.83 |
12 |
5.486 |
2.35 |
0.0360 |
|
Residual |
56.0 |
24 |
2.333 |
|
|
|
Total (corrected) |
299.7 |
47 |
|
|
|
Expected Mean
Squares
|
Source |
EMS |
|
Layout |
(6)+2.0(5)+6.0(2)+Q1 |
|
Operator(Layout) |
(6)+2.0(5)+6.0(2) |
|
Fixture |
(6)+2.0(5)+Q2 |
|
Layout*Fixture |
(6)+2.0(5)+Q3 |
|
Fixture*Operator(Layout) |
(6)+2.0(5) |
|
Residual |
(6) |
Variance
Components
|
Source |
Estimate |
|
Operator(Layout) |
1.083 |
|
Fixture*Operator(Layout) |
1.576 |
|
Residual |
2.333 |
|