|
Many of the new features in STATGRAPHICS
Centurion XV were added at the request of current users. A small
sample of these additions is shown below:
Graphical
ANOVA
Multiple Data Sheets
Cuscore Charts
Rich Edit Tables
Bayesian
Neural Network Classifier
Control Charts
for Non-Normal Data
Automatic
Selection of Distributions
Consolidated
System Preferences
Improved Contour Plots
Multivariate
Capability Analysis
Graphical ANOVA
The second edition of Statistics for Experimenters by
Box, Hunter and Hunter (Wiley, 2005) includes a new method for
displaying the results of an analysis of variance:
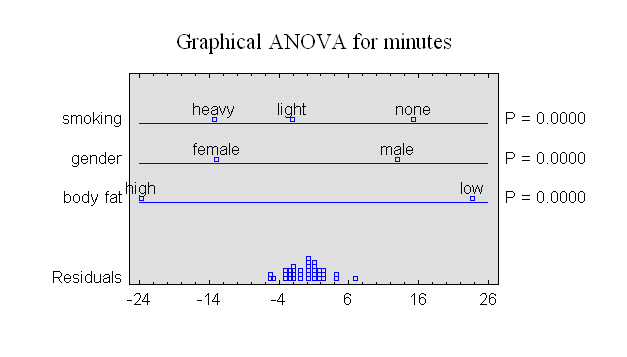
The deviations of each factor mean from the
grand mean are scaled so that their spread may be compared to
that of the residuals. Factor levels separated by more than that
exhibited in the residual distribution correspond to significant
differences.
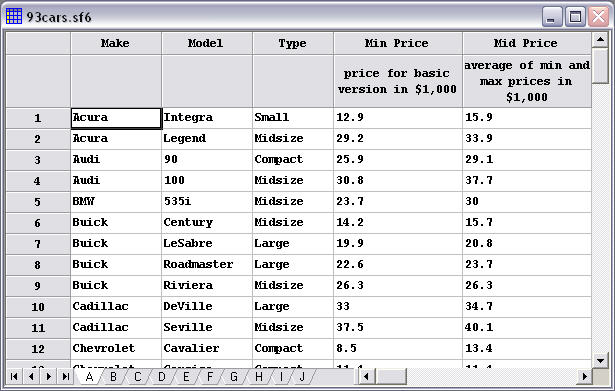
Multiple Data Sheets
The data window may now hold data from up to 10 different
data sources. Sheets may be linked to STATGRAPHICS data files,
Excel workbooks, ASCII files, or ODBC-accessible databases.
Sheets may be set to read-only if desired and polled
periodically to update the analyses:
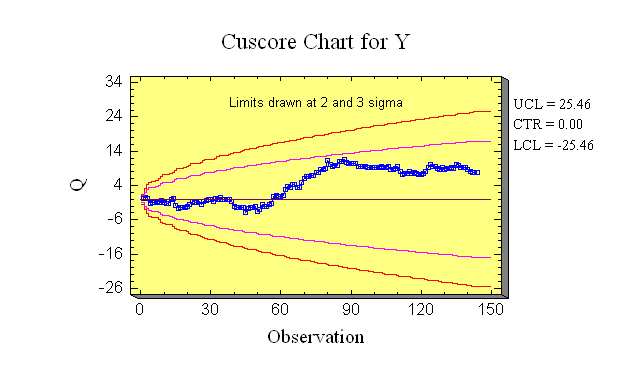
Cuscore Charts
Statistical Control by Monitoring and Feedback Adjustment by
Box and Luceno (Wiley, 1997) describes a method for constructing
control charts that are designed to detect specific types of
process disturbances. For example, the chart below is designed
to detect a sine wave with a period of 12:
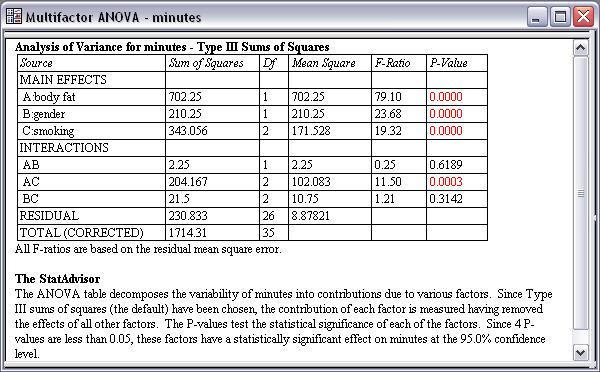
Rich Edit Tables for
Text Output
All text is now displayed in rich edit tables so that
numeric values may be easily pasted into applications such as
Microsoft Excel. Significant results may be highlighted in red
by the StatAdvisor:
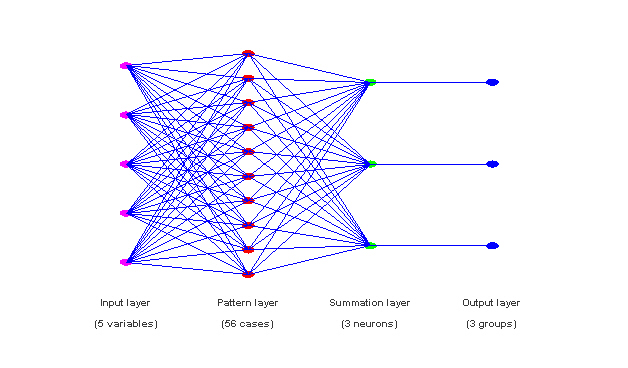
Bayesian Neural
Network Classifier
The Bayesian neural network classifies observations into
groups. It begins with prior probabilities for each group and
combines those priors with information from the data:
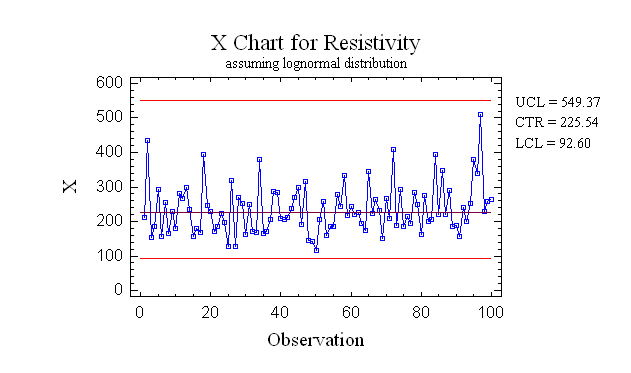
Control Charts for
Non-Normal Data
Both the Capability Analysis and Control Charts procedures
now allow you to handle non-normal data by either of 2 methods:
1. Transforming the data
2. Selecting one of 26 alternative distributions
The charts are displayed in the original
metric:
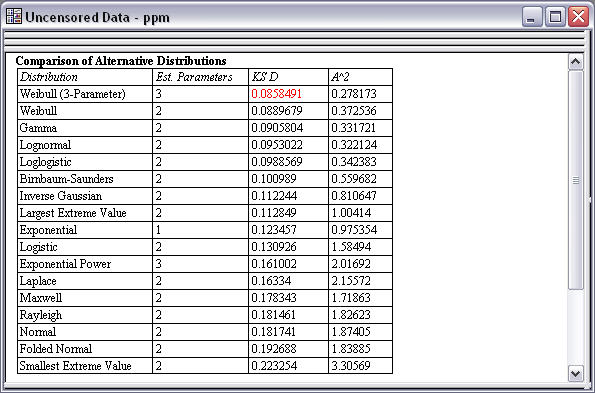
Automatic
Distribution Selection
Up to 45 probability distributions may be fit to a sample of
data and sorted according to their goodness of fit:
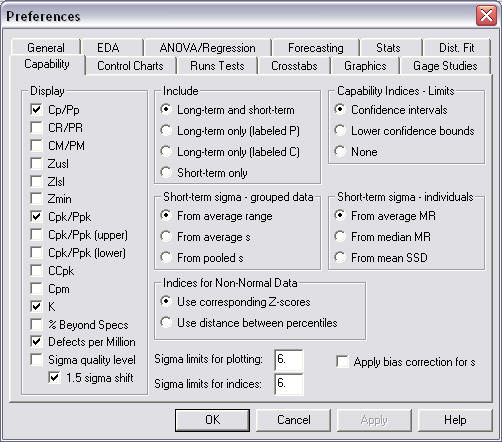
Consolidated System
Preferences
System preferences have been consolidated on a single tabbed
dialog box:
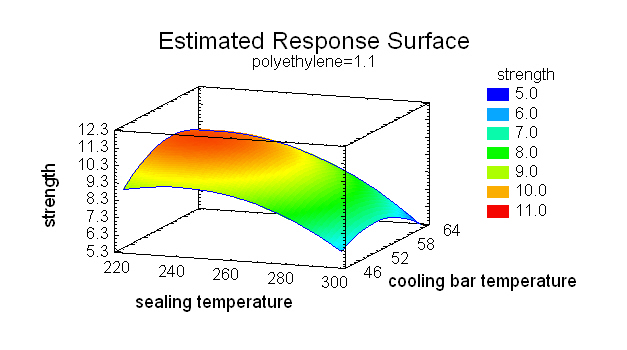
Improved Contour Plots
Color ramps may now be used to create contour plots and
contoured surfaces:
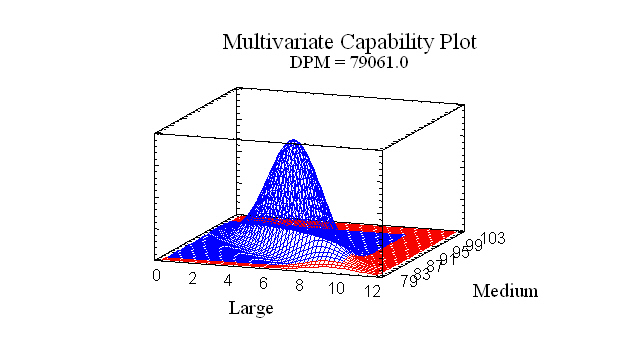
Multivariate
Capability Analysis
For processes with correlated variables, the
joint probability of being out of spec on one or more variables
can now be calculated:
|