|
STATGRAPHICS Centurion
contains a complete selection of procedures for basic
statistics. Among the many capabilities are:
1.
Summary Statistics -
calculation of sample means, medians, standard
deviations, and other summary statistics.
2.
One Sample Analysis -
characterization of a sample of data taken from a single
population.
3.
Outlier Identification -
statistical tests to determine whether one or more
outliers are present in a data sample.
4.
Comparison of Two Samples
- comparison of data taken under two different sets of
conditions.
5.
Analysis of Attribute Data
- methods for summarizing categorical data.
6.
Sample Size Determination -
calculation of required sample sizes for common
statistical problems.
7.
Probability Distributions
- calculation of probabilities and generation of random
numbers from 45 different probability distributions.
Summary Statistics
One of the purposes of
calculating statistics is to summarize the information in a
sample of data. In STATGRAPHICS Centurion, you can select
from a large number of summary statistics. Included are
statistics such as the Winsorized mean and Winsorized sigma,
which are less sensitive to outliers than the usual sample
mean and standard deviation. Also important are the
standardized skewness and standardized kurtosis, which test
whether the samples could reasonably have come from a normal
distribution. The StatAdvisor highlights in red any samples
with values that indicate significant non-normality.
|
|
MPG City |
MPG Highway |
Horsepower |
Fueltank |
Length |
Width |
|
Count |
93 |
93 |
93 |
93 |
93 |
93 |
|
Average |
22.37 |
29.09 |
143.8 |
16.66 |
183.2 |
69.38 |
|
Median |
21.0 |
28.0 |
140.0 |
16.4 |
183.0 |
69.0 |
|
Mode |
18.0 |
26.0 |
|
|
|
67.0 |
|
Geometric mean |
21.78 |
28.65 |
135.1 |
16.33 |
182.6 |
69.28 |
|
5% Trimmed mean |
21.83 |
28.72 |
140.1 |
16.64 |
183.3 |
69.31 |
|
5% Winsorized mean |
22.04 |
28.85 |
142.6 |
16.59 |
183.3 |
69.38 |
|
Variance |
31.58 |
28.43 |
2743. |
10.75 |
213.2 |
14.28 |
|
Standard deviation |
5.62 |
5.332 |
52.37 |
3.279 |
14.6 |
3.779 |
|
Coeff. of variation |
25.13% |
18.33% |
36.41% |
19.68% |
7.971% |
5.447% |
|
Standard error |
0.5827 |
0.5529 |
5.431 |
0.3401 |
1.514 |
0.3919 |
|
5% Winsorized sigma |
4.763 |
4.595 |
49.6 |
3.079 |
13.25 |
3.808 |
|
MAD |
3.0 |
3.0 |
30.0 |
2.1 |
9.0 |
3.0 |
|
Sbi |
4.566 |
4.675 |
49.21 |
3.311 |
14.35 |
3.817 |
|
Minimum |
15.0 |
20.0 |
55.0 |
9.2 |
141.0 |
60.0 |
|
Maximum |
46.0 |
50.0 |
300.0 |
27.0 |
219.0 |
78.0 |
|
Range |
31.0 |
30.0 |
245.0 |
17.8 |
78.0 |
18.0 |
|
Lower quartile |
18.0 |
26.0 |
103.0 |
14.5 |
174.0 |
67.0 |
|
Upper quartile |
25.0 |
31.0 |
170.0 |
18.8 |
192.0 |
72.0 |
|
Interquartile range |
7.0 |
5.0 |
67.0 |
4.3 |
18.0 |
5.0 |
|
1/6 sextile |
18.0 |
25.0 |
92.0 |
13.2 |
172.0 |
66.0 |
|
5/6 sextile |
28.0 |
33.0 |
185.0 |
20.0 |
198.0 |
74.0 |
|
Intersextile range |
10.0 |
8.0 |
93.0 |
6.8 |
26.0 |
8.0 |
|
Skewness |
1.704 |
1.23 |
0.9517 |
0.1081 |
-0.09009 |
0.264 |
|
Stnd. skewness |
6.71 |
4.842 |
3.747 |
0.4258 |
-0.3547 |
1.039 |
|
Kurtosis |
4.004 |
2.614 |
1.111 |
0.1272 |
0.4493 |
-0.2464 |
|
Stnd. kurtosis |
7.882 |
5.146 |
2.187 |
0.2504 |
0.8844 |
-0.4851 |
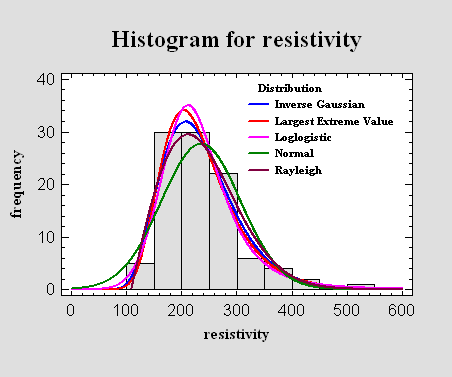
One Sample Analysis
When n
observations have been collected from a single population,
it is common to display the data in the form of a histogram.
Any of 45 probability distributions can then be fit to the
data, so that predictions can be made about future samples
from the underlying population.
Outlier Identification
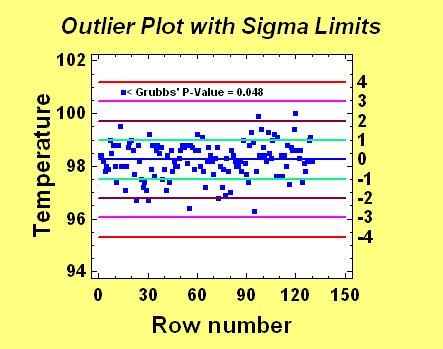
Everyone who analyzes
data has been faced with the problem of determining whether
or not an apparent abnormality should be left in the data
set or removed. The implications of wrongly making either
decision can be serious. In STATGRAPHICS Centurion, the
Outlier Identification procedure calculates several
tests (including Grubbs' test and Dixon's test) to determine
whether a suspected value is a likely outlier.
Comparison of Two Samples
A very common statistical
problem is that of comparing two samples and determining
whether or not there is a significant difference between
them. STATGRAPHICS Centurion provides procedures for
comparing both paired and unpaired samples. t tests, F
tests, and nonparametric signed rank tests are all
available. In addition to the standard numerical output, the
StatAdvisor provides guidance and suggestions regarding the
analysis.
|
Comparison of Means
95.0% confidence interval for mean of Placebo:
118.3 +/- 6.477 [111.8,124.7]
5.0% confidence interval for mean of Test Agent:
100.0 +/- 3.285 [96.72,103.3]
95.0% confidence interval for the difference between
the means
not assuming equal variances: 18.27 +/- 7.023 [11.24,25.29]
t
test to compare means
Null
hypothesis: mean1 = mean2
Alt. hypothesis: mean1 NE mean2
not assuming equal variances: t = 5.423 P-value =
0.00002557
Reject the null hypothesis for alpha = 0.05.
The
StatAdvisor
This
option runs a t-test to compare the means of the two
samples. It also constructs confidence intervals or
bounds for each mean and for the difference between
the means. Of particular interest is the confidence
interval for the difference between the means, which
extends from 11.24 to 25.29. Since the interval does
not contain the value 0.0, there is a statistically
significant difference between the means of the two
samples at the 95.0% confidence level.
A t-test
may also be used to test a specific hypothesis about
the difference between the means of the populations
from which the two samples come. In this case, the
test has been constructed to determine whether the
difference between the two means equals 0.0 versus
the alternative hypothesis that the difference does
not equal 0.0. Since the computed P-value is less
than 0.05, we can reject the null hypothesis in
favor of the alternative.
NOTE:
these results do not assume that the variances of
the two samples are equal. In this case, the
variances appear to be significantly different based
on the results of an F-test to compare the standard
deviations. You can see the results of that test by
selecting Comparison of Standard Deviations from the
Tabular Options menu. |
Analysis of Attribute Data
When the data consist of
attributes rather than variables, the statistical methods
needed to analyze it are different. In such cases, interest
normally centers around rates or proportions. The
Tabulation, Crosstabulation, Contingency
Tables, Comparison of Proportions, and
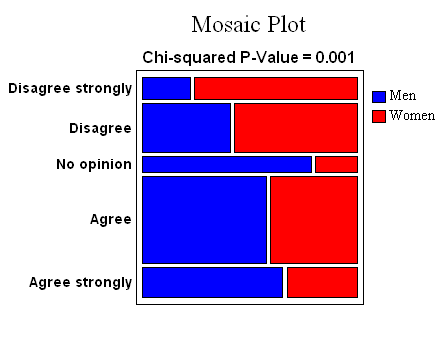
Comparison of Rates procedures are all relevant. For two
categorical variables, the Mosaic Plot provides a useful way
of visualizing any association.
Sample Size Determination
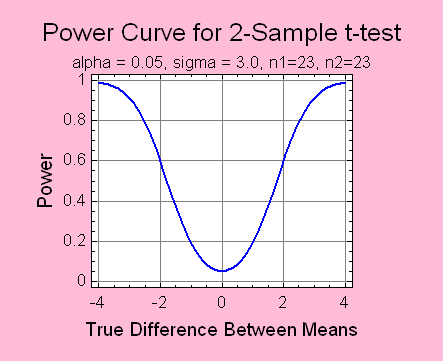
STATGRAPHICS Centurion
provides procedures for determining adequate sample sizes
for problems involving means, standard deviations, rates or
proportions. Sample sizes may be based on the desired width
of a confidence interval or on the power of the relevant
hypothesis test.
Probability
Distributions
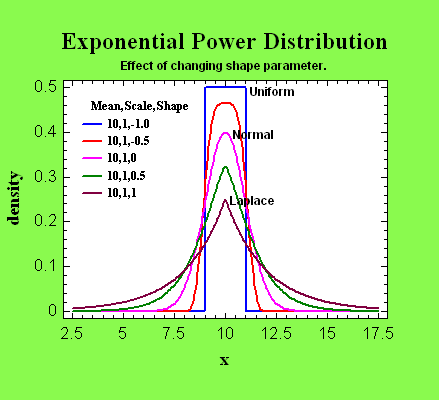
STATGRAPHICS Centurion
contains routines for calculating 45 probability
distributions. Tail areas, critical values, and random
numbers can be generated.
|

