|
An important technique
used to determine how well a process meets a set of
specification limits is called a process capability
analysis. A capability analysis is based on a sample of
data taken from a process and usually produces:
1. An estimate of the
DPMO (defects per million opportunities).
2. One or more capability indices.
3. An estimate of the Sigma Quality Level
at which the process operates.
STATGRAPHICS provides
capability analyses for the following cases:
1.
Measurement data for
uncorrelated variables. This is appropriate for
variables that operate independently of one another and
for which it is sufficient to make separate capability
statements about each. The analysis may be based on the
Gaussian distribution or any of 25 other probability
distributions.
2.
Measurement data for correlated
variables. This is used for variables that tend
to move together and which must be considered
simultaneously in order to make a proper statement about
the capability of the process.
3. Attribute data
that occur in the form of counts or
proportions. The analysis may be based on either
a binomial or hypergeometric distribution.
4. Attribute data
that occur in the form of rates.
The analysis may be based on either a Poisson or
negative binomial distribution.
Capability Analysis for
Uncorrelated Measurements
Traditionally, process
capability analysis has been based on the assumption that
each variable that characterizes a product or service
behaves independently. In such cases, it is sufficient to
make separate capability
statements about each. Unless the defect rate is
high, so that there is a significant chance that more than
one variable will be out of spec at the same time, the
overall capability can be calculated from the sum of the
defect rates of each response.
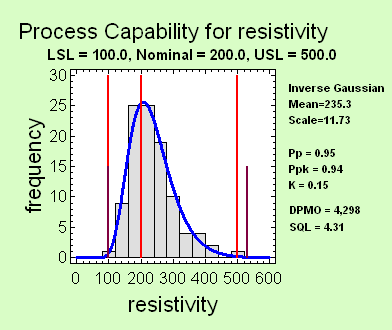
For such data,
STATGRAPHICS calculates the DPMO and capability indices for
each variable separately. Any of 26 probability
distributions may be used. A typical capability plot is
shown below:

Capability Analysis for Correlated Measurements
When the variables that
characterize a process are correlated, separately estimating
the capability of each may give a badly distorted picture of
how well the process is performing. In such cases, it is
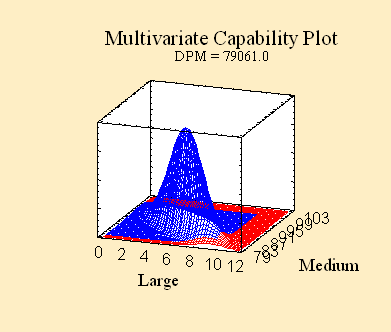
necessary to estimate the joint probability that one
or more variables will be out of spec. This requires fitting
a multivariate probability distribution, an example of which
is shown below:

Capability Analysis for Counts or Proportions
When examination of an item or event results
in a PASS or FAIL rather than a measurement, the capability
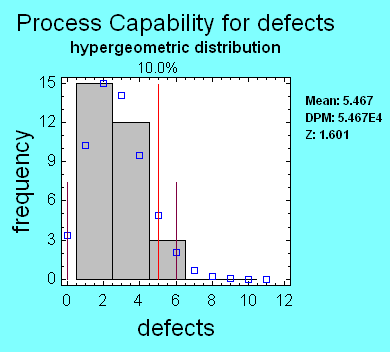
analysis must be based on a discrete distribution. For very
large lots, the relevant distribution is the binomial. For
small lots or cases of limited opportunities for failure,
the hypergeometric distribution must be used:

Capability Analysis for
Rates
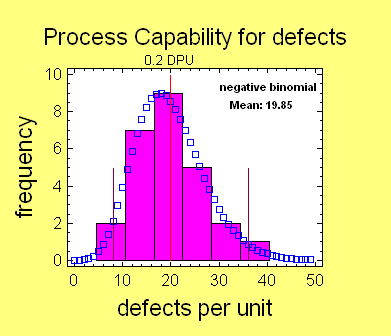
When the relevant measure of performance is a
rate, then the capability analysis is based on: a
Poisson distribution if failures occur randomly; a negative
binomial distribution if failures tend to occur in clumps.
 |

