|
STATGRAPHICS Centurion
contains a set of procedures that implement multivariate
statistical methods. These include:
1.
Correlation Analysis -
estimation of correlation coefficients between pairs of
variables.
2.
Principal Components - identification of linear
combinations of variables with large variance.
3.
Factor Analysis -
identification of unique factors in a set of
quantitative variables.
4.
Canonical Correlations -
construction of linear combinations of two sets of
variables with high inter-correlation.
5.
Cluster Analysis - separation
of observations or variables into groups with similar
characteristics.
6.
Discriminant Analysis -
construction of linear discriminant functions to help
classify observations.
7.
Bayesian Neural Network Classifier
- classification of observations given prior group
probabilities.
Correlation Analysis
The Correlation
Analysis procedure calculates correlations between pairs
of quantitative variables. Pearson product-moment
correlations, Kendall and Spearman rank correlations, and
partial correlation coefficients may be estimated. The
StatAdvisor will highlight in red all P-Values that indicate
statistically significant correlations.
Correlations
|
|
MPG City |
MPG Highway |
Horsepower |
Length |
RPM |
Width |
Weight |
|
MPG City |
|
0.9439 |
-0.6726 |
-0.6662 |
0.3630 |
-0.7205 |
-0.8431 |
|
|
|
(93) |
(93) |
(93) |
(93) |
(93) |
(93) |
|
|
|
0.0000 |
0.0000 |
0.0000 |
0.0003 |
0.0000 |
0.0000 |
|
MPG Highway |
0.9439 |
|
-0.6190 |
-0.5429 |
0.3135 |
-0.6404 |
-0.8107 |
|
|
(93) |
|
(93) |
(93) |
(93) |
(93) |
(93) |
|
|
0.0000 |
|
0.0000 |
0.0000 |
0.0022 |
0.0000 |
0.0000 |
|
Horsepower |
-0.6726 |
-0.6190 |
|
0.5509 |
0.0367 |
0.6444 |
0.7388 |
|
|
(93) |
(93) |
|
(93) |
(93) |
(93) |
(93) |
|
|
0.0000 |
0.0000 |
|
0.0000 |
0.7270 |
0.0000 |
0.0000 |
|
Length |
-0.6662 |
-0.5429 |
0.5509 |
|
-0.4412 |
0.8221 |
0.8063 |
|
|
(93) |
(93) |
(93) |
|
(93) |
(93) |
(93) |
|
|
0.0000 |
0.0000 |
0.0000 |
|
0.0000 |
0.0000 |
0.0000 |
|
RPM |
0.3630 |
0.3135 |
0.0367 |
-0.4412 |
|
-0.5397 |
-0.4279 |
|
|
(93) |
(93) |
(93) |
(93) |
|
(93) |
(93) |
|
|
0.0003 |
0.0022 |
0.7270 |
0.0000 |
|
0.0000 |
0.0000 |
|
Width |
-0.7205 |
-0.6404 |
0.6444 |
0.8221 |
-0.5397 |
|
0.8750 |
|
|
(93) |
(93) |
(93) |
(93) |
(93) |
|
(93) |
|
|
0.0000 |
0.0000 |
0.0000 |
0.0000 |
0.0000 |
|
0.0000 |
|
Weight |
-0.8431 |
-0.8107 |
0.7388 |
0.8063 |
-0.4279 |
0.8750 |
|
|
|
(93) |
(93) |
(93) |
(93) |
(93) |
(93) |
|
|
|
0.0000 |
0.0000 |
0.0000 |
0.0000 |
0.0000 |
0.0000 |
|
Correlation
(Sample Size)
P-Value
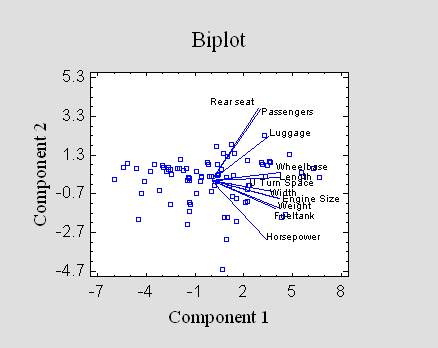
Principal Components
When many characteristics
are measured, it is not uncommon to obtain redundant
information. As a way of reducing dimensionality, the
Principal Components procedure finds linear combinations
of quantitative variables with high variability. Frequently,
a small number of such components is sufficient to explain
most of the observed variability in a data set. Constructing
models for the principal components may then be an easier
and more instructive task than attempting to model all of
the original measurements.

Factor Analysis
When a small number of
components explain most of the observed variability in a
data set, it may be possible to give a meaningful
interpretation to those factors. STATGRAPHICS allows you to
rotate the factor space in an attempt to simplify the factor
equations.
Factor Loading
Matrix After Varimax Rotation
|
|
Factor |
Factor |
|
|
1 |
2 |
|
Engine Size |
0.8598 |
0.4022 |
|
Horsepower |
0.9106 |
0.006172 |
|
Fueltank |
0.8594 |
0.2957 |
|
Passengers |
0.2096 |
0.883 |
|
Length |
0.7651 |
0.5536 |
|
Wheelbase |
0.7392 |
0.5914 |
|
Width |
0.8418 |
0.3894 |
|
U Turn Space |
0.7489 |
0.3971 |
|
Rear seat |
0.1902 |
0.8742 |
|
Luggage |
0.4323 |
0.7462 |
|
Weight |
0.917 |
0.34 |
|
|
Estimated |
Specific |
|
Variable |
Communality |
Variance |
|
Engine Size |
0.901 |
0.09904 |
|
Horsepower |
0.8292 |
0.1708 |
|
Fueltank |
0.8261 |
0.1739 |
|
Passengers |
0.8236 |
0.1764 |
|
Length |
0.8919 |
0.1081 |
|
Wheelbase |
0.8962 |
0.1038 |
|
Width |
0.8603 |
0.1397 |
|
U Turn Space |
0.7186 |
0.2814 |
|
Rear seat |
0.8005 |
0.1995 |
|
Luggage |
0.7437 |
0.2563 |
|
Weight |
0.9565 |
0.0435 |
Canonical Correlations
When the variables are
divided into two groups, it can be useful to obtain linear
combinations from each group that have high correlation
between them. These Canonical Correlations often
provide insight into the relationships between the groups.
Canonical
Correlations
|
|
|
Canonical |
Wilks |
|
|
|
|
Number |
Eigenvalue |
Correlation |
Lambda |
Chi-Squared |
D.F. |
P-Value |
|
1 |
0.8953 |
0.9462 |
0.02753 |
301.8 |
28 |
0.0000 |
|
2 |
0.4958 |
0.7041 |
0.2629 |
112.2 |
18 |
0.0000 |
|
3 |
0.4629 |
0.6804 |
0.5215 |
54.7 |
10 |
0.0000 |
|
4 |
0.02916 |
0.1708 |
0.9708 |
2.486 |
4 |
0.6472 |
Coefficients
for Canonical Variables of the First Set
|
Engine Size |
0.2617 |
0.6984 |
-0.07371 |
2.05 |
|
Horsepower |
0.1275 |
0.4043 |
1.239 |
-0.7845 |
|
Length |
0.02418 |
1.063 |
0.2796 |
-0.05425 |
|
Wheelbase |
0.04117 |
0.3449 |
0.7107 |
-1.45 |
|
Width |
-0.0677 |
0.2929 |
-1.512 |
-1.089 |
|
Rear seat |
0.004258 |
-0.09294 |
-0.07899 |
-0.2616 |
|
Weight |
0.6578 |
-2.425 |
-0.4708 |
1.191 |
Coefficients
for Canonical Variables of the Second Set
|
Mid Price |
0.2566 |
0.1546 |
1.211 |
-0.4017 |
|
1/MPG Highway |
-0.09713 |
-2.205 |
0.1757 |
-1.515 |
|
1/MPG City |
0.6521 |
1.425 |
-0.7964 |
2.809 |
|
U Turn Space |
0.3222 |
0.455 |
-0.3407 |
-1.337 |
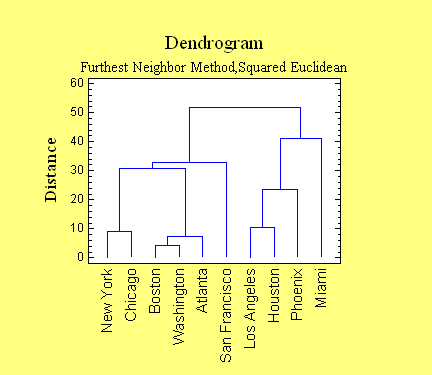
Cluster Analysis
The Cluster Analysis
procedure divides data into groups with similar
characteristics. Clustering may be done using either
observations or variables. The techniques provided for
clustering include nearest neighbor, furthest neighbor,
centroid, median, group average, Ward's method, and the
method of k-means.

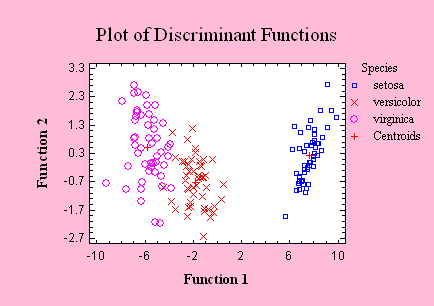
Discriminant Analysis
The Discriminant
Analysis procedure derives linear combinations of
quantitative variables that can best divide data into
groups. The resulting discriminant functions can then be
used to classify new observations.

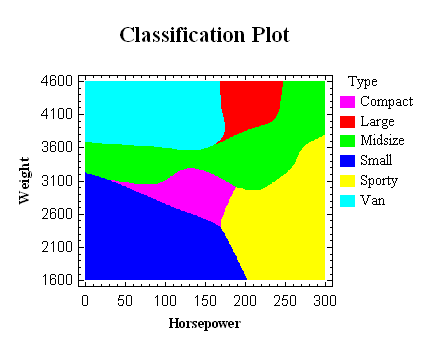
Bayesian Neural Network Classifier
The Bayesian Neural
Network Classifier classifies observations into groups
by combining information from a training set with prior
probabilities. It can be used to predict the relative
likelihood that an observation belongs to each of several
groups.

|

