|
Multivariate Six
Sigma is an extension of the traditional Six Sigma
methodologies to deal with processes in which multiple
response variables are measured and in which the quality of
a product depends on the joint values of those variables or
attributes. Rather than concentrating on each response
variable separately using univariate methods, multivariate
statistical methods are employed to explain the multiple
responses as an integrated whole. In complex processes in
which the variables exhibit strong correlations, misleading
results can be obtained if the multiple responses are not
considered together.
STATGRAPHICS Centurion
contains a powerful set of procedures for implementing
Multivariate Six Sigma. Among the tools provided are:
Multivariate
Graphical Displays - includes tools such as radar
plots, glyphs, matrix plots, draftsman and casement plots.
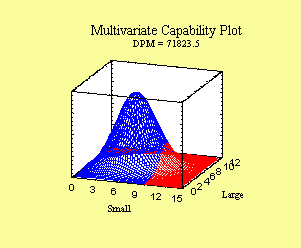
Multivariate
Capability Analysis - estimates the joint
probability that a set of variables will be within
established specifications based on a multivariate normal
distribution.
|
|
Sample |
Sample |
|
|
|
|
Variable |
Mean |
Std. Dev. |
LSL |
Nominal |
USL |
|
Small |
6.09821 |
2.51154 |
|
5.0 |
10.0 |
|
Large |
5.68214 |
1.94171 |
|
5.0 |
10.0 |
|
|
Observed |
Estimated |
Estimated |
|
Variable |
Beyond
Spec. |
Beyond
Spec. |
DPM |
|
Small |
5.35714% |
6.01462% |
60146.2 |
|
Large |
1.78571% |
1.30827% |
13082.7 |
|
Joint |
7.14286% |
7.18235% |
71823.5 |
The
StatAdvisor
This
procedure determines the percentage of items beyond
a set of multivariate specification limits. In this
case, the estimated frequency of non-conformities
with respect to at least one of the 2 variables
equals 71823.5 per million. |
 |
Multivariate
Control Charts - plots a T-squared chart, control
ellipse, or Multivariate EWMA control chart to detect
variation attributable to special causes.
Neural Network
Classifier - classifies observations into groups
based upon the values of multiple response variables.
Multivariate
Calibration - uses Partial Least Squares to analyze
data in which there are more variables than observations.
Principal
Components Analysis - derives linear combinations of
multiple responses that describe the principal variation
amongst multiple response variables.
Multiple Response
Optimization - provides a procedure for maximizing
the desirability of multiple responses after a designed
experiment has been performed.
|

