|
STATGRAPHICS Centurion
provides a number of tools for use in assessing the quality
of a product or service. Among the tools most widely used in
Six Sigma are:
1.
Pareto Chart - used to display
the "vital few" areas where quality improvement will
have the biggest impact.
2.
Quality Function Deployment Matrix - used to
help associate customer demands with design
requirements.
3.
Cost of Quality Trend Analysis - examines
changes in the cost of quality over time.
4.
Cause-and-Effect Diagram -
used to help understand the factors that affect the
quality of a process.
5.
Process Map - used to chart the flow or
interrelationships in a process.
6.
Six Sigma Calculator -
converts between DPM, Cpk, Z, SQL, and other quality
metrics.
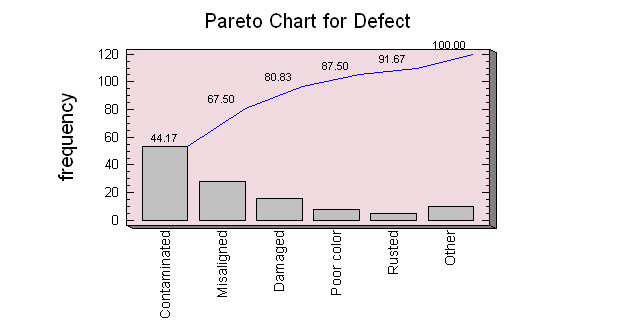
Pareto Chart
Pareto charts are often
used to determine the "vital few" causes that are
responsible for the majority of defects or complaints
regarding a product or service.
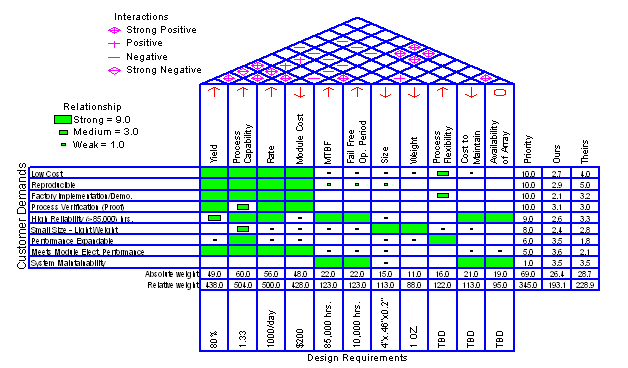
Quality Function Deployment Matrix
QFD is a customer-driven
planning process by which products and services are matched
to the needs of customers. STATGRAPHICS illustrates the
relationship between customer needs and design requirements
by constructing a "House of Quality".
Cost of Quality Trend Analysis
A COQ (Cost-of-Quality)
trend analysis illustrates the cost of poor quality by
constructing a chart displaying prevention, appraisal, and
failure costs over time. Runs tests are also performed to
search for significant trends.

Cause-and-Effect Diagram
Cause-and-effect
or fishbone diagrams illustrate the causes of a
problem or effect by creating a diagram resembling the
skeleton of a fish.

Process Map
Process maps are commonly
used to create flow charts and other step-by-step diagrams.
An example of a simple map is shown below.
Six Sigma Calculator
The STATGRAPHICS Six
Sigma Calculator converts between various commonly used
quality metrics. After entering the value of any one metric,
the equivalent values of the others are calculated.

|